
Aluminium Markets Explained: Alumina, Electricity, Recycling and Physical Premiums
Trace aluminium from bauxite to finished products, separating power costs, refining bottlenecks, exchange inventories and delivered-price premiums.
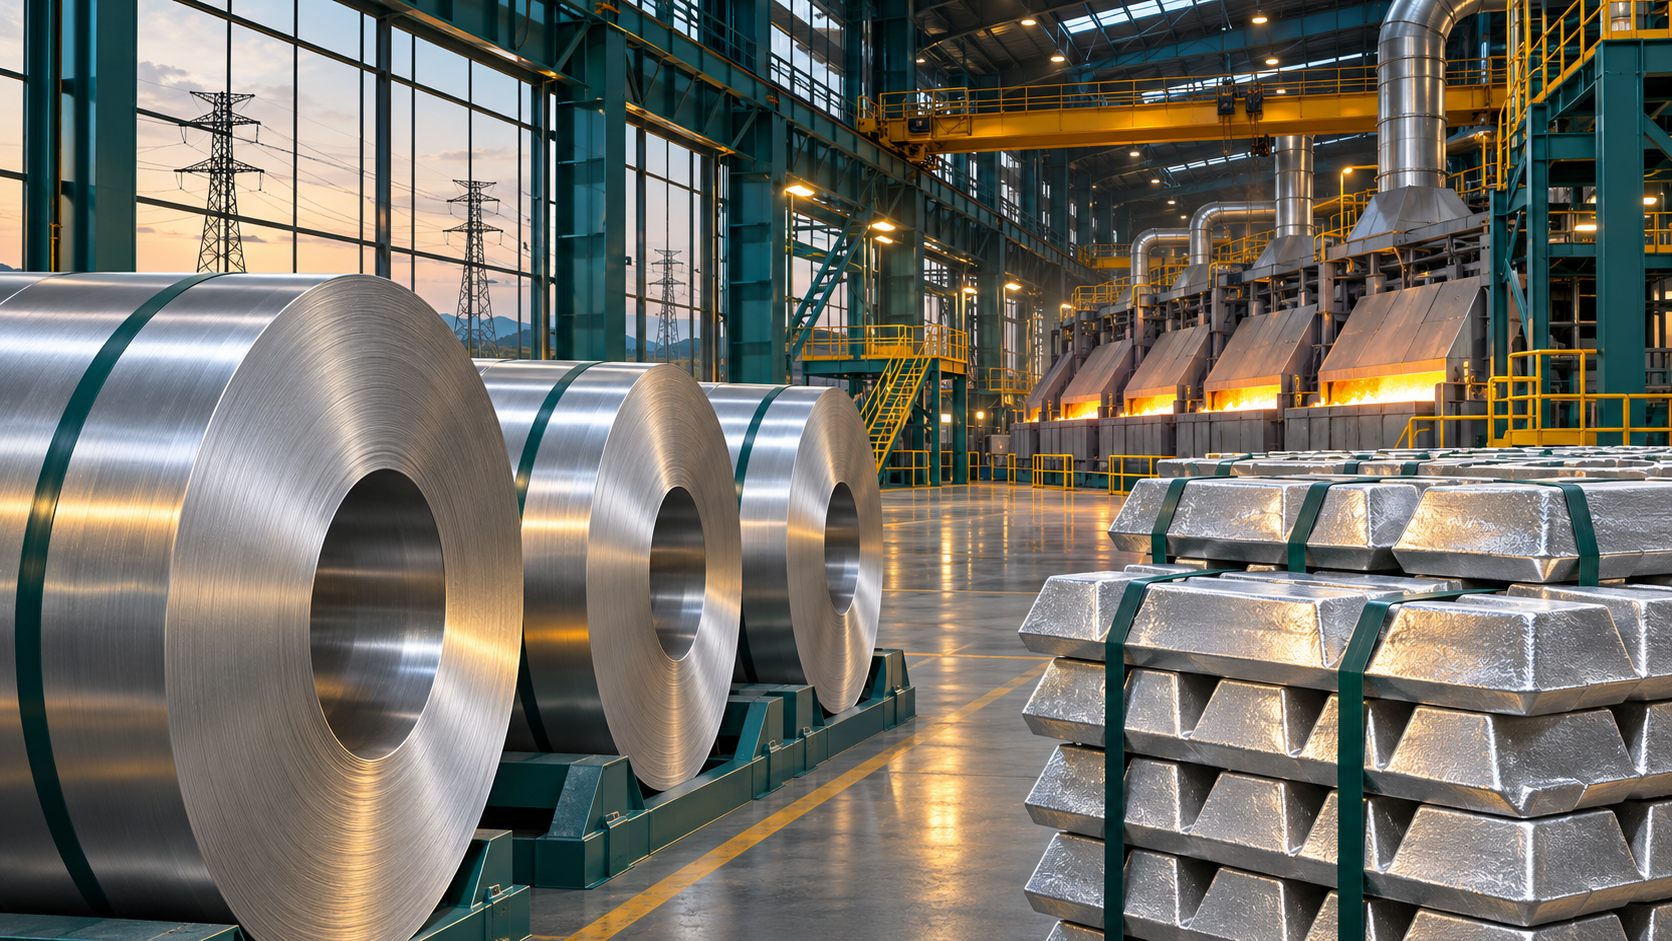
Follow the chain from ore to usable metal
Aluminium markets connect mineral extraction, chemical refining, electricity-intensive smelting and manufacturing. Bauxite is refined into alumina, and alumina is reduced into primary aluminium through an electrolytic process. The resulting metal is cast and transformed into products such as sheet, extrusion and wire. Each stage has its own capacity, costs and logistics. A disruption at a refinery does not have the same immediate effect as a shortage of finished sheet, even though both belong to the aluminium economy. Recycling adds a parallel route that returns suitable scrap to usable metal. Market analysis becomes clearer when the reader identifies the specific stage affected before interpreting a price headline. This guide focuses on those industrial relationships rather than predicting a market price or recommending a position in futures, physical metal or producer shares.
Alumina is a separate bottleneck
The availability of bauxite does not automatically guarantee abundant alumina at a particular smelter. Refineries need suitable feedstock, energy, chemicals, maintenance and transport links. Ore quality and impurities influence processing economics, while disruptions to ports or shipping can separate production from delivery. An alumina shortage can raise smelter input costs even if the aluminium benchmark remains relatively stable. Conversely, expanding refining output may ease one constraint without solving a shortage of reliable electricity at the smelting stage. Distinguish tonnes of bauxite, tonnes of alumina and tonnes of metal; they are not interchangeable volume measures. Integrated companies may offset pressure in one segment with gains in another, whereas standalone smelters have a different exposure. Reading segment margins and contractual purchasing arrangements is more informative than assuming every aluminium producer reacts identically to the same input-price change.
Electricity changes the geography of competitiveness
Primary smelting requires substantial and dependable electrical power. The relevant cost is not necessarily the spot electricity price seen in a financial headline: smelters may have long-term contracts, dedicated generation, regulated arrangements or hedging. Reliability also matters because the production system is not equivalent to a machine that can be switched off and restarted without consequences. In an explicitly hypothetical calculation, a smelter using 14 megawatt-hours per tonne experiences an additional 280 currency units per tonne if its effective electricity price rises by 20 per megawatt-hour. This is a sensitivity illustration, not a claim about a specific plant's consumption or total cost. Alumina, carbon materials, labor, maintenance and financing still matter. Compare power arrangements and operating efficiency before concluding that a global energy shock affects every producer equally.
Capacity is not the same as available production
Installed smelting capacity describes a technical potential, while actual output depends on utilization, maintenance, electricity supply and commercial decisions. A curtailed plant may require time, capital and technical preparation before restarting. Announced capacity additions also need commissioning, inputs and stable operating performance before they become dependable supply. This makes the response to higher prices slower than a simple supply curve might suggest. Examine whether a production announcement refers to annual nameplate capacity, a monthly run rate or actual metal shipped. Compare periods consistently and separate temporary outages from permanent closures. The same logic applies downstream: abundant primary metal does not guarantee enough rolling or extrusion capacity in the required specification. Industrial bottlenecks are stage-specific, and spare capacity in the wrong location or process cannot immediately satisfy every order.
The benchmark is only one part of the delivered price
Physical buyers commonly face an all-in price combining a metal benchmark with a regional premium and additional product or delivery components. Premiums reflect the terms of a particular market, including location, availability, duties where applicable and logistics. Fabrication charges compensate for transforming primary metal into a required form. In a hypothetical quote, a benchmark of 2,200 plus a regional premium of 250 and a fabrication charge of 400 produces 2,850 per tonne before any other separately specified items. If the benchmark falls by 100 but the premium rises by 150, the corresponding total rises by 50, with other components unchanged. Therefore, a declining exchange price does not guarantee a lower invoice. Always compare currency, unit, quality, location, delivery date and duty treatment before treating two quotations as equivalent.
Exchange stocks are a window, not the whole warehouse
Exchange warehouse reports provide structured information about metal held within the relevant delivery system. They do not measure every tonne at producers, consumers, private warehouses or in transit. Stock movement can reflect financing arrangements, delivery choices and relocation as well as changes in industrial consumption. Distinguish metal available under exchange warrants from metal for which delivery procedures have been initiated, using the exchange's definitions. A fall in reported stocks can indicate tighter available supply, but the inference requires context about location, brand eligibility, warehouse flows and off-exchange holdings. Likewise, rising stocks can coexist with shortages of a particular product or regional delivery. Read inventories alongside premiums, nearby spreads, production and shipment evidence. No single stock series reveals the entire physical balance, and a headline percentage change can exaggerate significance when the initial reported base is small.
Recycling changes energy demand but needs suitable scrap
Recycling aluminium generally requires much less energy than producing primary metal from ore, but it is not an unlimited substitute available instantly. Scrap must be collected, sorted, transported and processed, with alloy chemistry and contamination influencing usable output. New manufacturing scrap differs from material recovered after years of use in buildings or vehicles. Demand growth cannot always be met from old products because that metal may still be serving its original purpose. Mixing alloys can limit the applications for recovered metal unless sorting or blending resolves the specification problem. Evaluate recycling rates together with collection boundaries and the definition of recycled content; these measures answer different questions. A claim about energy savings should identify its system boundary rather than treating remelting electricity as equivalent to the full life-cycle energy of primary production.
Industrial demand depends on specifications and timing
Transport, construction, packaging and electrical applications create different demand cycles. Vehicle production depends on model schedules and component inventories; construction responds to project pipelines and financing; packaging follows other consumption patterns. Substitution toward lighter materials can support aluminium use in one application while a cyclical slowdown weakens total orders. A producer's shipments may also reflect customer restocking rather than final consumption. Distinguish orders, shipments and end use, and identify whether the relevant product is primary ingot, an alloy, rolled sheet or an extrusion. Currency movements influence local purchasing costs when benchmark contracts are denominated elsewhere. This is why broad GDP growth is useful context but insufficient as a metal demand forecast. The most informative evidence links a specific manufacturing activity to its metal intensity, inventory behavior and available processing capacity.
Carbon claims require a defined production boundary
The electricity source used in smelting affects emissions, but electricity is not the only part of the production footprint. Refining energy, process emissions, carbon materials, transport and recycling assumptions can also matter depending on the assessment boundary. A low-carbon label should therefore be accompanied by a method, verification and a clear definition of the product being measured. Do not compare a smelter-only metric with a cradle-to-gate estimate as though both describe the same scope. Commercial premiums for particular attributes depend on contracts, customer requirements and verification, rather than following automatically from a lower reported intensity. Policy and procurement frameworks can change, so current eligibility rules require separate checking. For economic analysis, separate physical production cost, documented environmental characteristics and the price a buyer is actually willing to pay for those characteristics.
Build a stage-by-stage market reading
Start by identifying the product, geography and time horizon. Track bauxite and alumina availability separately from smelting output, and examine effective power costs rather than relying only on energy headlines. Decompose the delivered price into benchmark, premium and fabrication terms. Compare exchange stocks with physical delivery evidence, then test whether customer shipments represent final demand or inventory rebuilding. For recycled supply, inspect scrap availability and quality rather than assuming every tonne can replace any primary specification. Finally, evaluate producer exposure through integration, contracts and operating capacity. Explicit hypothetical sensitivities can show how costs change without pretending to forecast prices. Data from the IAI, IEA, USGS and LME supply complementary pieces, not interchangeable measures. A sound conclusion states where the bottleneck sits, which participants bear it and what evidence would demonstrate that it is easing.
Test a scenario. Explore the market.
Hypothetical inputs for learning. Change the assumptions to see the arithmetic; these are not current market values or forecasts.
Same period for both inputs. Before taxes and fees. Formula: (1 + return) ÷ (1 + inflation) − 1. Methodology ↗
Input limits: returns, inflation and currency changes −99% to 1,000%; duration 0–30; yield changes −200 to 200 basis points.
Open an interactive market chart
Market context, not a direct measure of every subject in this article. Provider data may be delayed or unavailable. Check the instrument, quote currency and timestamp.
Open the full market workspace →Sources & further reading
Primary institutional sources underpin this educational guide. Follow the links for the original definitions, methods and research. Hypothetical examples in the text are explanatory, not current quotes or forecasts.
- USGS: Bauxite and Alumina Statistics ↗
- USGS: Aluminum Statistics ↗
- IEA: Aluminium Production, Energy and Emissions ↗
- IAI: Primary Aluminium Production ↗
- IAI: Smelting Energy Intensity ↗
- IAI: Recycling Energy Comparison ↗
- LME: Aluminium Premiums ↗
- LME: Warehouse and Stock Reports ↗
- LME: Aluminium Contract ↗
- IEA: Electricity Composition in Aluminium Production ↗
Explore the data and markets
Continue your research
All guides →
Fertilizer Markets Explained: Nutrients, Energy Costs and Farm Margins
Separate nitrogen, phosphate and potash supply chains, then trace nutrient costs through seasonal purchasing, farm budgets and food-market transmission.

Carbon markets explained: allowances, credits and the integrity of climate claims
Distinguish compliance allowances from carbon credits, and examine baselines, additionality, durability, retirement and corporate accounting.

Silver: how industrial demand and monetary demand interact
Understand silver through electronics, solar intensity, jewellery, investment flows, by-product mining, recycling and inventory mechanics.