
Fertilizer Markets Explained: Nutrients, Energy Costs and Farm Margins
Separate nitrogen, phosphate and potash supply chains, then trace nutrient costs through seasonal purchasing, farm budgets and food-market transmission.
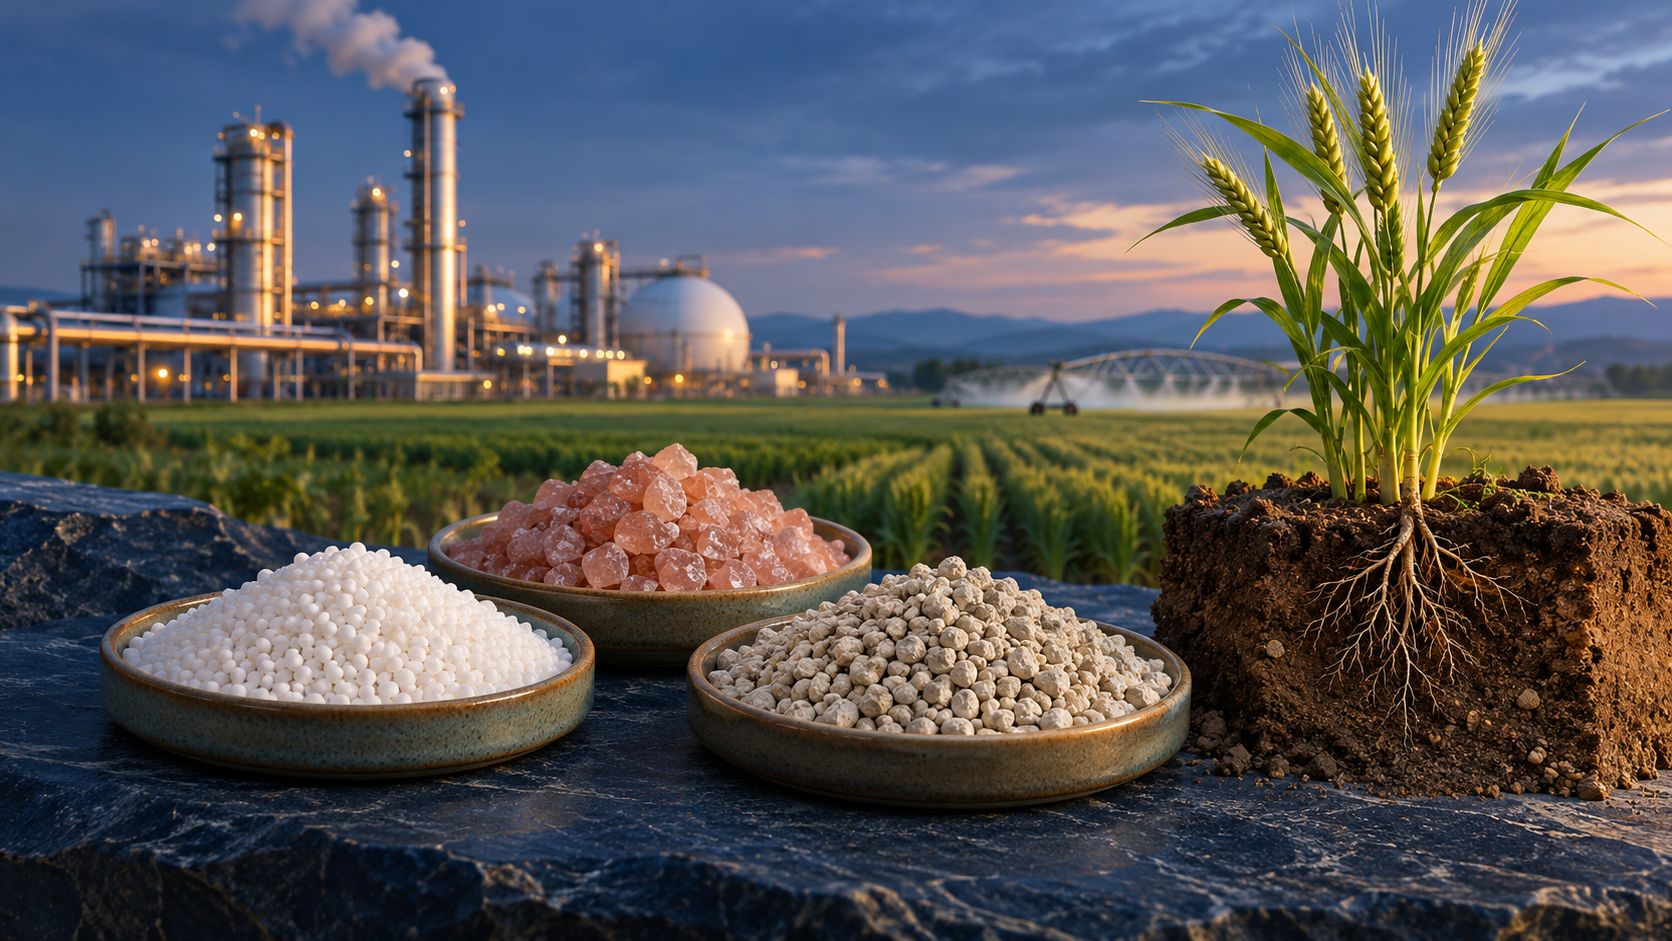
Fertilizer is several nutrient markets, not one commodity
Fertilizer markets connect chemistry, energy, mining, transport and farm economics. Nitrogen, phosphorus and potassium serve different plant functions and are supplied through products with different production chains. A price index that combines them can conceal a nitrogen shortage alongside comfortable potash availability. Nutrients are not interchangeable merely because products are sold in similar bags. Compound fertilizers combine nutrients in stated proportions, while application decisions depend on crops, soils and local agronomic conditions. This guide explains market transmission rather than prescribing farm application rates. The central analytical task is to identify which nutrient and product is constrained, how that constraint changes delivered cost and when farmers must make purchasing decisions. Only then can a reader judge the implications for farm margins, fertilizer demand and potentially later food production.
Nitrogen links natural gas to ammonia and downstream products
Ammonia is the starting material for mineral nitrogen fertilizers. Conventional production commonly uses natural gas to provide hydrogen and energy, while other routes use different feedstocks or electricity-based hydrogen. Ammonia can be applied or converted into products such as urea and nitrates, adding further processing and logistical requirements. A rise in gas cost can therefore pressure ammonia economics and transmit into downstream nitrogen products, but pass-through depends on contracts, regional gas markets, plant efficiency and competing supply. Do not substitute the crude oil price for a local natural gas price without explaining the relationship. Some producers face different energy arrangements or feedstocks and may remain competitive while others curtail output. The product price is also influenced by demand and trade, so production cost is an important constraint rather than a mechanical formula determining every quotation.
Phosphates combine mining with chemical conversion
Phosphate fertilizers begin with phosphate rock, but the mine is only the first stage. Processing and conversion into plant-available products require industrial facilities and additional inputs. Products such as monoammonium phosphate and diammonium phosphate also incorporate ammonia, linking part of their economics to nitrogen production. Sulfur and sulfuric acid supply can matter in the wider processing chain. A fertilizer shortage can therefore arise from chemical conversion or logistics even when mineral reserves are large. Reserve estimates describe a resource under stated assumptions, not the quantity immediately deliverable before planting. Compare rock quality, processing capacity, maintenance and export availability separately. Integrated producers may control several stages, but integration does not eliminate outages or transport bottlenecks. Market analysis should identify the constrained input rather than treating all phosphate price movements as evidence of depleted geological resources.
Potash depends on mineral supply and transport networks
Potash refers to potassium-bearing materials used chiefly in fertilizers, with products differing in composition and suitability. Mining, processing, rail access, ports and shipping determine how mineral output reaches farms. Its cost structure is not identical to natural-gas-based ammonia, although energy still matters for operations and transport. Concentrated production or export routes can make the market sensitive to disruptions without implying that nitrogen and phosphate will move by the same percentage. Product selection also depends on crop and soil considerations, so a cheaper potassium product is not automatically an agronomically equivalent substitute in every situation. For financial analysis, separate product grade, nutrient content and delivery terms. Large quantities located far from the importing region may offer little immediate relief when transport is constrained. The geography of available supply matters as much as the global production total.
Compare nutrient units before comparing prices
A tonne of fertilizer product is not a tonne of nutrient. Published nutrient statistics commonly express nitrogen as N, phosphorus as P2O5 and potassium as K2O, which must not be confused with one another or silently converted into elemental weights. Product grades describe nutrient proportions by weight. In a hypothetical example, a tonne of material priced at 460 units and containing 46 percent nitrogen contains 460 kilograms of N, implying one currency unit per kilogram of N before delivery and application costs. A different product priced lower per tonne may still cost more per unit of nutrient. Multi-nutrient products require an allocation across nutrients rather than attributing the entire price to one component. Comparable quotations need the same currency, mass unit, grade, location and timing. This arithmetic supports market comparison; it does not establish field application advice.
Affordability depends on crop revenue as well as fertilizer cost
Farmers assess fertilizer within a wider budget that includes expected crop prices, yield response, seed, fuel, labor, finance and land costs. A fertilizer price decline can still leave affordability worse if crop prices fall faster. Conversely, higher fertilizer cost may be manageable when expected crop revenue rises sufficiently, although cash and credit constraints can still bind. In an explicit hypothetical budget, expected revenue of 1,200 units and nonfertilizer costs of 700 leave 500 before fertilizer. Raising fertilizer cost from 200 to 300 reduces the residual from 300 to 200, a one-third decline, with everything else unchanged. This is not a farm forecast: actual yields, prices and other costs are uncertain. Ratios of fertilizer to crop prices summarize one pressure but cannot capture field-specific response, working capital or the full profitability distribution across farms.
The planting calendar controls transmission timing
Fertilizer demand is seasonal, but the global market combines different planting calendars and crop systems. Importers and distributors may build inventory well before application, making their purchase price different from the spot quotation observed when farmers buy. A production outage during a low-demand period may be manageable through inventories, while the same outage close to a narrow application window can be more disruptive. Weather can delay field access and alter delivery schedules without changing the underlying nutrient requirement. Restocking and destocking can amplify wholesale price movements relative to final farm use. Therefore, compare price dates with ordering, shipping and application dates rather than assuming immediate pass-through. Regional seasonal patterns are evidence to investigate, not a universal trading rule. Crop choices and local conditions can change the timing and composition of demand from one year to another.
Delivered cost includes freight, currency and finance
International fertilizer quotations may describe export-port or import-port terms rather than a farm-gate price. Ocean freight, insurance, inland transport, storage, handling, financing and local distribution can create a large gap. Currency depreciation raises local costs for an importer even when the foreign-currency benchmark is unchanged. Trade measures and administrative delays can also affect availability, but current policy details must be verified for the relevant date and jurisdiction. Do not infer a specific restriction from a generic price spike. Physical product characteristics matter because different fertilizers require appropriate handling and storage arrangements. A lower overseas quote is not necessarily accessible to every buyer at the same quality or delivery date. Reconstruct the chain from quoted origin to intended destination, identifying which costs are fixed, variable or already locked into existing contracts.
Food-price effects are conditional and delayed
Higher fertilizer costs can influence planted area, nutrient use, crop choice and farm margins, but the eventual effect on food supply depends on weather, soil conditions, inventories and farmers' responses. Cutting expenditure is not always equivalent to cutting nutrient effectiveness: improved timing or targeting can change efficiency, while inappropriate reductions can damage yields. Such decisions require local agronomic assessment rather than a universal rule. Commodity food prices then pass through processing, transport, retail and consumer demand before reaching household bills. Fertilizer therefore creates an important upstream channel without determining the entire food-inflation outcome. Avoid applying the same percentage increase in fertilizer prices to food prices. The appropriate analysis specifies which crops are exposed, the relevant season, available alternatives and the share of costs affected, while acknowledging uncertainty about biological and market responses.
Read the market through a nutrient-to-margin framework
Begin by naming the nutrient, product grade, unit and delivery location. Map its production inputs: gas and ammonia for relevant nitrogen products, rock and chemical conversion for phosphates, and mining plus transport for potash. Examine plant operations and trade flows before interpreting reserves as near-term supply. Convert product prices into comparable nutrient units where appropriate, then connect delivered cost to crop revenue and the purchasing calendar. Separate wholesale restocking from final application and current prices from inventory acquired earlier. Explicit hypothetical budgets can illustrate sensitivity without claiming to forecast yields. FAO, IEA, USGS, World Bank, USDA and university extension sources provide complementary evidence, each with its own period and definitions. A useful conclusion identifies the specific bottleneck and timing, then explains how it reaches farm finances before making any broader claim about food markets.
Test a scenario. Explore the market.
Hypothetical inputs for learning. Change the assumptions to see the arithmetic; these are not current market values or forecasts.
Same period for both inputs. Before taxes and fees. Formula: (1 + return) ÷ (1 + inflation) − 1. Methodology ↗
Input limits: returns, inflation and currency changes −99% to 1,000%; duration 0–30; yield changes −200 to 200 basis points.
Open an interactive market chart
Market context, not a direct measure of every subject in this article. Provider data may be delayed or unavailable. Check the instrument, quote currency and timestamp.
Open the full market workspace →Sources & further reading
Primary institutional sources underpin this educational guide. Follow the links for the original definitions, methods and research. Hypothetical examples in the text are explanatory, not current quotes or forecasts.
- IEA: Ammonia Technology Roadmap ↗
- USGS: Phosphate Rock Statistics ↗
- USGS: Potash Statistics ↗
- FAO: Fertilizer Specifications ↗
- FAO: Inorganic Fertilizers 2002–2023 ↗
- World Bank: Fertilizer Markets and Affordability ↗
- USDA ERS: Fertilizer Use and Price ↗
- USDA ERS: Fertilizer and Crop Price Volatility ↗
- Rutgers Extension: Fertilizer Costs per Acre ↗
- University of Nebraska: Managing High Fertilizer Costs ↗
- Penn State Extension: Fertilizer Prices and Seasonality ↗
Explore the data and markets
Continue your research
All guides →
Aluminium Markets Explained: Alumina, Electricity, Recycling and Physical Premiums
Trace aluminium from bauxite to finished products, separating power costs, refining bottlenecks, exchange inventories and delivered-price premiums.

Carbon markets explained: allowances, credits and the integrity of climate claims
Distinguish compliance allowances from carbon credits, and examine baselines, additionality, durability, retirement and corporate accounting.

Silver: how industrial demand and monetary demand interact
Understand silver through electronics, solar intensity, jewellery, investment flows, by-product mining, recycling and inventory mechanics.