
Water scarcity and economic risk: productivity, prices and the limits of adaptation
Trace water risk through agriculture, industry, energy and household budgets, while distinguishing true savings, scarcity pricing and local exposure.
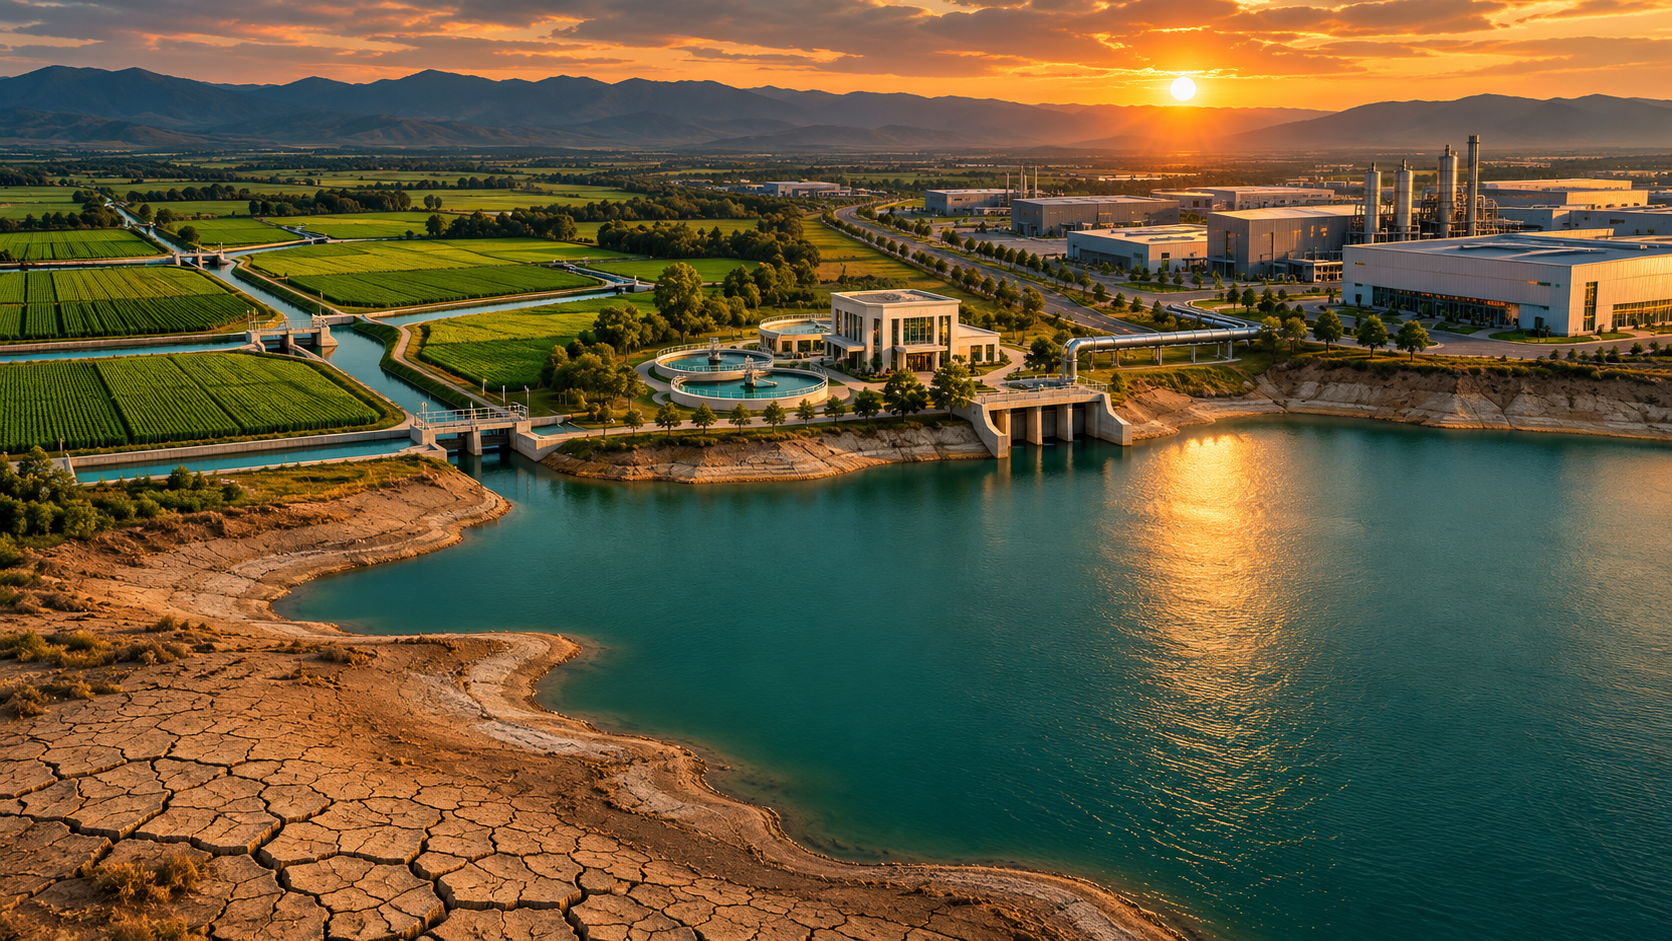
Scarcity is about usable water in a particular place
Water scarcity is not simply a shortage of rainfall. An economy can receive substantial rain while households and firms lack dependable water because storage, treatment, distribution or institutions are inadequate. Conversely, a dry region can secure reliable supply through infrastructure, reuse, careful allocation and imported goods. The economic question concerns water of sufficient quality, in the required location and season, at a cost that users and public finances can sustain.
This distinction prevents misleading national comparisons. Annual renewable resources do not reveal whether a specific industrial cluster faces restrictions during its peak production season. A basin can be stressed while the national average looks comfortable. UN-Water treats scarcity as a relative condition involving supply, demand and access. For economic analysis, map the physical system and the institutions controlling it before translating a broad climate indicator into claims about growth, inflation or company earnings.
Separate withdrawals, consumption and stress
Withdrawals measure water taken from a source; consumption concerns the portion not returned in a usable form to the relevant system over the relevant period. Return flows can be available to downstream users, although quality and timing may change. Treating every withdrawal as permanent depletion exaggerates some impacts, while ignoring groundwater depletion or pollution understates others. Boundaries determine the meaning of the numbers.
FAO's water efficiency indicator relates economic value added to water use, while water stress indicators compare withdrawals with available renewable resources, accounting for environmental requirements in the relevant methodology. Neither is a complete welfare measure. An economy can show higher value added per cubic metre because its sector mix changes, even without better technology inside each sector. Before interpreting improvement, ask whether the denominator, prices, production composition or actual physical performance changed. National annual indicators should be complemented by basin and seasonal evidence.
Agriculture connects water risk to food and incomes
Water availability influences planting decisions, crop yields, livestock conditions and rural employment. Rainfed farming is exposed to rainfall timing, while irrigated farming depends on access rights, infrastructure, energy and source reliability. A shortage at a critical growth stage can matter more than an equivalent shortage outside that stage. The effect on food prices then depends on inventories, trade, transport and the ability to substitute other supplies.
Imagine a hypothetical region where irrigation deliveries fall during flowering rather than after harvest. Farm output and labour demand may decline even if annual rainfall is only moderately below normal. Some farmers can switch crops or purchase water; others cannot finance the adjustment. The distribution of losses therefore depends on assets and institutions as well as hydrology. A credible economic account follows the chain from water access to yields, household income and market supply rather than assuming a fixed relationship between rainfall and inflation.
Efficient irrigation does not always save basin water
An irrigation upgrade may reduce water applied at the field without reducing total basin consumption. Water that previously returned to a river or aquifer may now be consumed by crops, or farmers may expand irrigated acreage after the cost per unit of output falls. FAO guidance stresses the difference between apparent savings and reductions in consumption or nonrecoverable flows. The system boundary is therefore essential.
In a hypothetical case, a farm cuts withdrawals from 100 units to 80, but return flows fall from 40 to 20. Consumptive use remains 60. The farm's pumping bill may improve, yet the basin has not gained the 20 units implied by the withdrawal comparison. This does not make the technology useless; it changes the benefit being claimed. Evaluation should distinguish energy savings, yield improvements, reduced pollution and genuine water savings, then examine whether allocation rules prevent the saved capacity from being consumed elsewhere.
Industrial exposure is about interruption and quality
Industries use water for cooling, cleaning, processing and incorporation into products. The financial significance can exceed the direct water bill because a small unavailable input can stop a much larger production process. Required quality varies: water suitable for one purpose may need extensive treatment for another. UNESCO's industry analysis highlights both availability and quality as sources of operational and supply chain risk.
Consider a hypothetical plant whose water purchases represent a small share of costs but whose production cannot continue during a two day interruption. Estimating risk only from the annual water expense misses lost output, restart costs and contractual consequences. Supplier concentration adds another layer if multiple facilities depend on the same basin. A practical assessment maps critical process requirements, alternative supplies, storage duration and recovery time. It should also ask whether an alternative source remains available when neighbouring firms are trying to use it simultaneously.
Water and energy create a two way dependence
Energy systems need water in various extraction, generation and cooling processes, while water systems need energy for pumping, treatment and desalination. A water shock can therefore affect electricity supply, and an energy shock can increase the cost of delivering water. IEA analysis describes this relationship as a nexus because evaluating one side without the other can shift rather than resolve risk.
Desalination can diversify supply in suitable coastal settings, but it requires capital, energy, maintenance and management of environmental effects. It does not provide a costless substitute for every inland use. Reuse similarly needs appropriate treatment and distribution for its intended application. In a hypothetical planning comparison, a cheaper plant with fragile electricity access may be less reliable than a more expensive option with resilient power arrangements. Evaluate delivered service over its life, including outages and operating needs, rather than comparing construction costs alone.
Price signals need institutions and affordability
A water tariff may cover service delivery without fully representing scarcity, environmental damage or the cost of future infrastructure. Very low prices can weaken maintenance funding and conservation incentives, but raising tariffs without addressing leakage, unreliable service or household affordability can create hardship without solving the underlying problem. OECD guidance treats pricing as one instrument within a broader policy framework.
The design question is how to finance reliable service and manage scarce resources while protecting essential access. Metering, transparent allocation, targeted support and enforceable rules affect whether a price signal works. A hypothetical household with intermittent supply may pay more to informal vendors than a connected household pays through a public tariff. Comparing the official tariff alone misses that inequality. Economic analysis should distinguish the price of the service, the scarcity value of the resource and the distribution of access, rather than treating one number as the entire water economy.
Pollution reduces the effective supply
Water can be physically present yet economically unusable without costly treatment. Pollution changes the effective supply available to households, agriculture and industry, while damaged ecosystems can weaken the natural functions that support water security. The World Bank's water quality research emphasizes economic effects beyond the obvious visual signs of contamination. Monitoring is essential because the absence of a reported problem may reflect missing observations rather than clean water.
A hypothetical downstream factory may face higher treatment costs after upstream pollution even though river volume remains unchanged. Farmers may face different consequences depending on crop sensitivity and irrigation practices. These effects show why quantity and quality indicators must be read together. Responsibility also crosses administrative borders: the entity causing damage may not bear the full downstream cost. A useful economic account identifies the source, transmission route, affected users and enforcement capacity rather than treating pollution as an isolated environmental footnote.
From local scarcity to inflation and balance sheets
Water shocks can reach the wider economy through food supply, electricity, industrial production, health, trade and public spending. Their effects depend on duration, import access, inventories and policy responses. A temporary local interruption differs from persistent depletion that changes where production is viable. World Bank and BIS research help frame these channels, but scenario estimates should not be presented as certain forecasts for every country.
A hypothetical drought can reduce harvests, raise food import needs and weaken rural incomes at the same time. The resulting inflation pressure may coexist with slower growth, while government support and infrastructure repairs affect the budget. Banks may be exposed through borrowers concentrated in affected sectors or locations. Avoid adding every estimated loss together without checking overlap: lost farm income and lower agricultural output may describe the same underlying damage. The aim is a coherent transmission map, not the largest possible headline number.
A practical framework for economic water risk
Start with geography and seasonality, then identify the source, quality requirements and competing users. Check storage, groundwater trends, return flows, allocation rules and service reliability. Map the economic activities that depend on the resource and the alternatives available during a shared shock. Keep measured observations, modelled scenarios and policy assumptions separate. A national indicator can guide screening, but project and company decisions require more local evidence.
Finally, compare adaptation options by delivered reliability, lifetime cost and distributional effects. Leakage control, ecosystem protection, reuse, demand management and new supply address different problems and may complement one another. An original assessment should explain the constraint each option relaxes and what risk remains. Water is not merely another commodity with a single global price: it is a location specific production input, an essential household service and an ecosystem requirement. Sound economic interpretation keeps those roles visible instead of reducing them to one scarcity ranking.
Test a scenario. Explore the market.
Hypothetical inputs for learning. Change the assumptions to see the arithmetic; these are not current market values or forecasts.
Same period for both inputs. Before taxes and fees. Formula: (1 + return) ÷ (1 + inflation) − 1. Methodology ↗
Input limits: returns, inflation and currency changes −99% to 1,000%; duration 0–30; yield changes −200 to 200 basis points.
Open an interactive market chart
Market context, not a direct measure of every subject in this article. Provider data may be delayed or unavailable. Check the instrument, quote currency and timestamp.
Open the full market workspace →Sources & further reading
Primary institutional sources underpin this educational guide. Follow the links for the original definitions, methods and research. Hypothetical examples in the text are explanatory, not current quotes or forecasts.
- UN-Water: Water scarcity ↗
- UN-Water: Water stress monitoring ↗
- FAO: Water use efficiency indicator ↗
- FAO: Real water savings guidance ↗
- FAO: Reuse in agricultural systems ↗
- World Bank: High and Dry ↗
- World Bank: Quality Unknown ↗
- OECD: Water policy ↗
- OECD: Finance and investment for water ↗
- UNESCO: Water and industry ↗
- UNESCO: Groundwater and industry ↗
- IEA: Introduction to the water-energy nexus ↗
- BIS: The economics of water scarcity ↗
Explore the data and markets
Continue your research
All guides →
Foreign direct investment: flows, ownership and the links that create economic value
Read FDI beyond the headline by separating flows, stocks, reinvested earnings, pass-through funds, acquisitions and productive economic links.

Tourism and the economy: receipts, local value and the balance of payments
Understand why arrivals and tourism receipts differ from domestic value added, and how imports, seasonality and measurement shape the economic contribution.

Insurance, Reinsurance and Catastrophe Risk: How Losses Travel Through the System
Follow catastrophe losses through policy terms, reinsurance layers, capital markets and public finances, with a clear view of what remains uninsured.