
Agriculture and Food Price Shocks: From Harvests and Fertilizer to Household Costs
Trace how weather, stocks, energy, trade and currencies shape agricultural markets—and why supermarket prices respond differently.
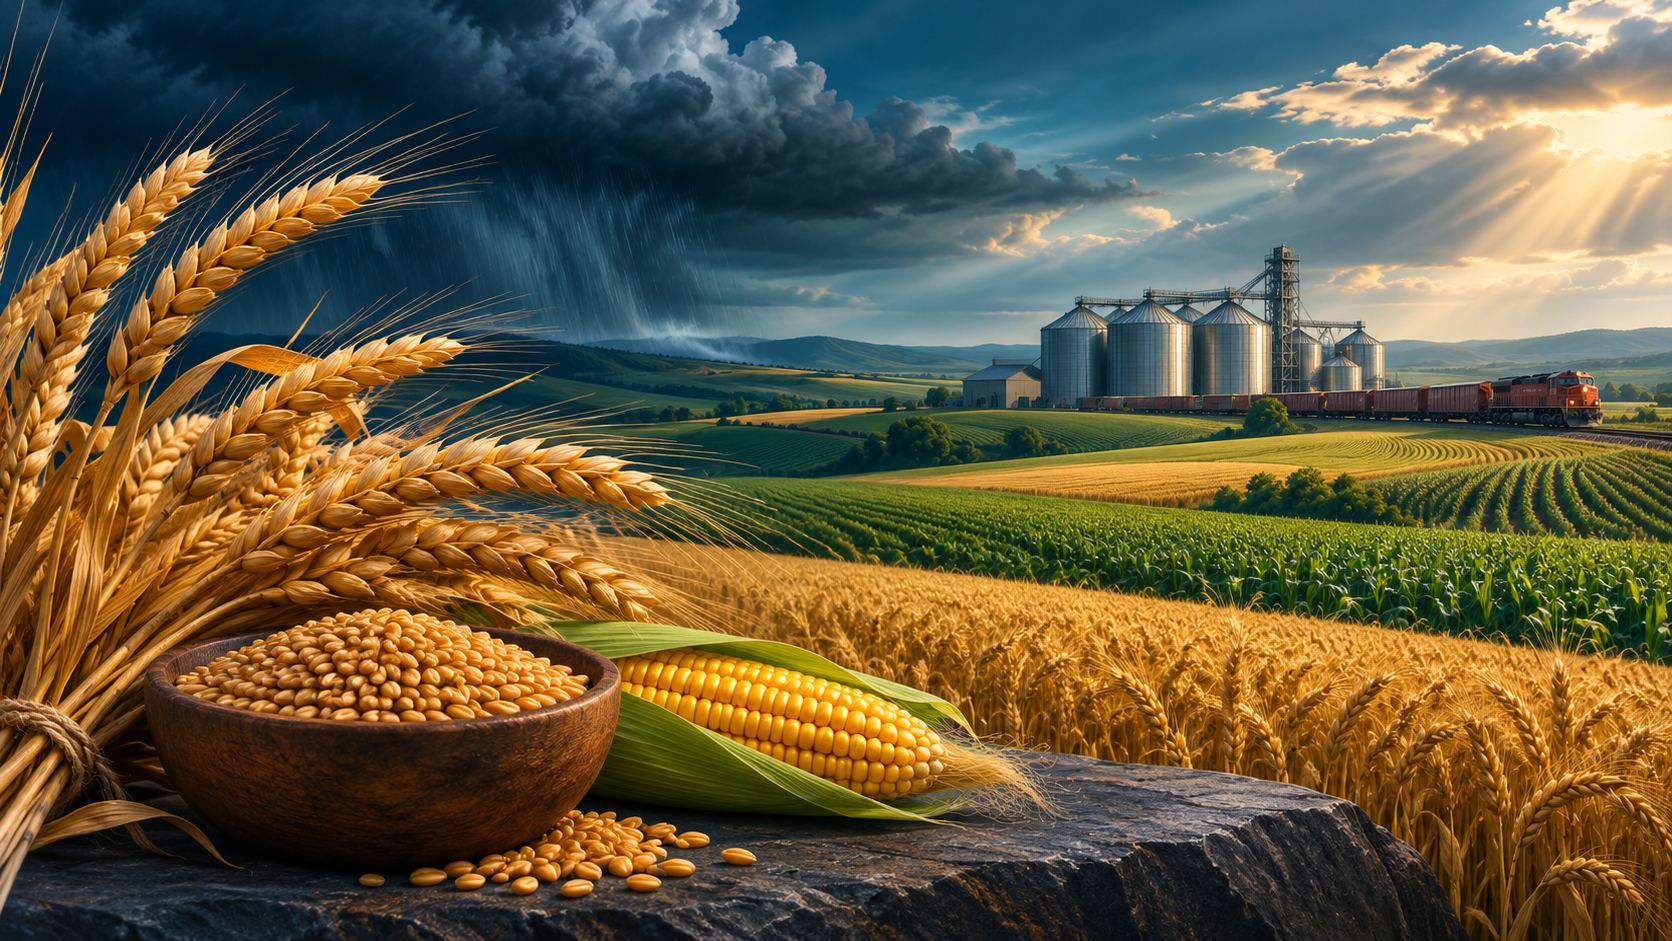
One food shock can produce several different prices
A drought headline, a grain futures quotation and a supermarket receipt describe different points in the food system. They are connected, but they are not interchangeable measures. A weather event changes expected harvest conditions; a traded commodity price reflects expectations about available supply and demand; a retail price includes processing, transport, labour and commercial decisions. Confusing these layers leads to exaggerated claims about what a single announcement means for households. This guide follows a shock from agricultural production to consumer prices. It explains mechanisms rather than presenting a current harvest forecast. The central questions are which crop and region are affected, what buffers exist, how trade can redistribute supply, and which costs actually reach the product that households buy. Every stage can delay, amplify or offset the original disturbance.
Read the supply and use balance before the headline
A commodity balance organizes beginning stocks, production, imports, domestic use, exports and ending stocks. For an individual country, imports add supply and exports remove it; at the global level, trade mainly reallocates the same material between countries, subject to statistical differences. Production alone therefore does not describe availability. In a hypothetical balance, ten units of opening stocks plus one hundred units of production create one hundred and ten units before trade. If total use is one hundred and five, five remain as ending stocks. A production increase can coexist with a tighter balance when use increases faster. The exercise is accounting, not a price forecast. Comparisons should use the same crop, measurement unit and marketing period because crop years can differ across countries and from calendar years.
Weather matters through location, timing and crop stage
The economic importance of bad weather depends on where it occurs and when the crop is vulnerable. Rain can benefit one region while disrupting planting or harvesting elsewhere. Heat stress during a sensitive growth stage may matter more than an equally hot period outside that window. Irrigation, soil conditions, crop varieties and farmers' ability to adapt also influence the result. An alarming weather map is therefore not a complete estimate of lost production. Analysts need planted area, expected yield, development stage and the geographic share of output exposed. Conditions may improve before harvest, while damage to quality can matter even when harvested weight is less affected. The appropriate language separates a risk to production from a measured loss and distinguishes a local event from a global supply change.
Stocks buffer shocks, but their location matters
Stored grain can bridge the time between harvests and cushion an unexpected shortfall. A stocks-to-use ratio compares a stock measure with a measure of consumption or total use, but its definition must be checked. The same ratio can conceal very different physical situations. Stocks may be concentrated in countries that do not readily export, held for strategic purposes, or unsuitable for a particular buyer's quality requirements. Storage losses and transport constraints also affect practical availability. A high global number does not guarantee that an importer can obtain grain quickly at a low delivered cost. Conversely, a low visible stock figure does not establish an immediate shortage without considering incoming harvests and demand adjustments. The useful question concerns accessible, usable supply during the relevant interval, not simply the largest reported aggregate.
Energy and fertilizer connect today’s costs to future harvests
Agriculture uses energy directly through machinery, irrigation, drying and transport, and indirectly through inputs such as fertilizer. Nitrogen fertilizer is particularly connected to energy and feedstock markets, while phosphate and potash have their own resource and processing chains. An input price shock does not translate into an identical percentage change in every crop price. Farmers differ in input intensity, existing contracts, soil conditions, financing and their ability to adjust practices. The timing also matters: a cost increase after inputs were purchased affects the current crop differently from one before planting. Lower fertilizer application may reduce costs but can also influence yield, depending on local conditions. Analysis should follow both the immediate income effect on farmers and the potential production effect in a later season, without assuming a universal response.
Trade redistributes supply while policy changes the available pool
International trade allows an importer to replace part of a domestic shortfall with production from elsewhere. That adjustment depends on export capacity, ports, freight, commercial relationships and the suitability of alternative products. Trade is a buffer, but it does not eliminate physical constraints. Export restrictions can reduce the pool available to foreign buyers even when global production has not changed. Import tariff reductions or public stock releases can work through different channels, with different fiscal and distributional consequences. The effect of a policy should be assessed separately for domestic consumers, farmers and overseas buyers. A measure intended to protect one group may shift costs to another. For market interpretation, distinguish a change in the quantity produced from a change in the quantity permitted or practically able to cross borders.
Exchange rates can offset an international price decline
A lower dollar quotation does not guarantee a cheaper import bill in local currency. Consider a hypothetical shipment priced at one hundred dollars. At an exchange rate of four local units per dollar, its commodity cost is four hundred units. If the dollar price falls to ninety while the exchange rate becomes five, that cost rises to four hundred and fifty local units before freight and other charges. The example isolates currency translation rather than predicting a country's prices. Importers may have contracts, hedges or stocks purchased at earlier rates, which changes timing. Domestic producers can also be affected because imported inputs become more expensive or export opportunities change. A complete explanation therefore compares the international commodity movement with the exchange rate and the local cost structure, rather than treating global prices as the household's actual price.
The farm commodity is only part of the retail product
Bread contains more than the cost of wheat. Milling, baking, packaging, energy, labour, transport, rent and retail operations contribute to the final bill. The relevant share varies greatly across products and countries. A raw commodity price doubling therefore does not imply that the retail product must double, while a commodity price decline does not require every other cost to fall. Contracts and inventories can delay adjustment in either direction. Differences between farm and retail prices are informative but do not, by themselves, prove a particular cause such as excess profit or inefficiency. The analysis requires comparable products, quality, units and time periods, together with evidence on other costs. Separating the farm component from the rest of the value chain makes the argument more precise and prevents misleading percentage comparisons.
Read food indexes as defined baskets
An international food commodity index summarizes a selected basket of traded products. A national consumer food index measures another basket, with local weights and retail observations. Neither necessarily matches the spending pattern of one household. A fall in an international index can coexist with rising domestic food inflation because of currency changes, local shortages, different product weights or delayed transmission. Even within one index, stronger cereal prices can be offset by weaker dairy or vegetable oil quotations. The headline then conceals divergent pressures. A useful comparison identifies what the index measures, the currency, the base period and whether the observation is monthly or annual. Changes in the rate of inflation should also be separated from changes in the level of prices: slower increases do not mean the earlier rise has been reversed.
Exposure differs between households and producers
The same price increase can affect net food buyers and net food sellers differently. A farmer may receive a higher crop price while facing an even larger rise in fertilizer, fuel or debt-service costs. An urban household may experience the shock mainly through food spending, while a rural household can combine farming income with purchased food. Budget shares, income stability and access to substitutes influence the strain. Aggregate inflation is therefore not a complete measure of distributional impact. Policy analysis should identify who pays, who receives income and whether support reaches the intended group. Broad price controls, targeted transfers, stock management and supply investment have different mechanisms and constraints. Describing those trade-offs is more useful than assuming that one national average represents every household or that every producer benefits from higher commodity prices.
Sources & further reading
Primary institutional sources underpin this educational guide. Follow the links for the original definitions, methods and research. Hypothetical examples in the text are explanatory, not current quotes or forecasts.
- FAO: Food Price Index ↗
- FAO: Cereal Supply and Demand Brief ↗
- FAO: Crop Prospects and Food Situation ↗
- USDA: WASDE report ↗
- USDA ERS: Drivers of fertilizer markets ↗
- USDA ERS: Fertilizers and pesticides ↗
- World Bank: Open markets and food system resilience ↗
- USDA ERS: Macroeconomics and agriculture questions and answers ↗
- USDA ERS: Food Dollar ↗
- USDA ERS: Price spreads from farm to consumer ↗
- FAO: Uneven transmission of cereal price shocks ↗
- OECD-FAO: Agricultural Outlook 2026–2035 ↗
- FAO: Prices across the food supply chain ↗
Explore the data and markets
Continue your research
All guides →
Copper and Industrial Demand: Reading Construction, Grids, Supply and Inventories
How copper links industrial activity, electrification, mining and recycling—and why its price is an imperfect economic barometer.
Natural Gas Markets: Why Geography, LNG and Storage Shape Regional Prices
Understand the infrastructure, contracts and seasonal forces linking gas markets without turning them into a single uniform price.
Commodity Futures Curves: Contango, Backwardation and the Economics of Time
Understand how storage, scarcity, seasonality and contract rolls shape commodity curves—and why a futures curve is not a price forecast.