
Natural Gas Markets: Why Geography, LNG and Storage Shape Regional Prices
Understand the infrastructure, contracts and seasonal forces linking gas markets without turning them into a single uniform price.
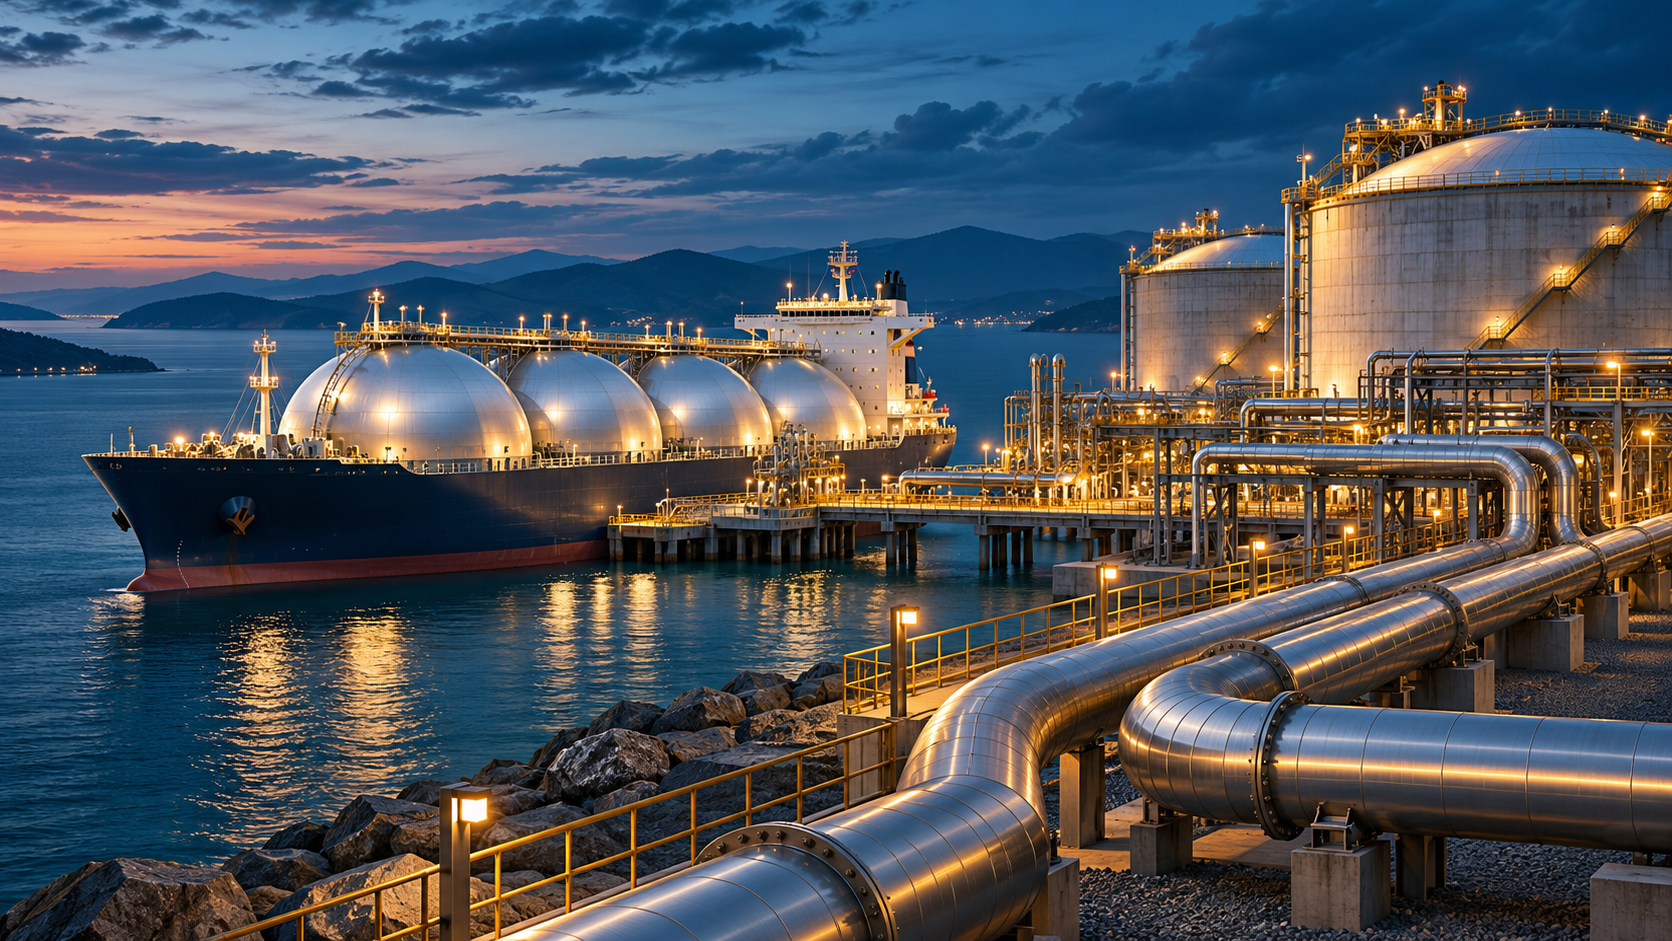
Start with geography, not a single global price
Natural gas is traded internationally, but a molecule cannot move between buyers as easily as a price quotation moves across a screen. Gas needs a pipeline or an industrial chain that cools it into liquefied natural gas, transports it by ship and returns it to gaseous form. Each stage has capacity limits, operating costs and commercial conditions. This makes location central to price formation. Two regions can have different prices without presenting an immediately usable arbitrage opportunity. The relevant question is whether an additional unit can physically and legally reach the higher-priced market in the required period. This guide separates regional benchmarks, transport constraints, storage and contractual flexibility. It explains a market structure rather than providing a current price outlook or a recommendation to trade energy products.
Benchmarks describe different delivery arrangements
Henry Hub is an important United States benchmark connected to a physical pipeline hub in Louisiana. European discussion frequently references the Dutch Title Transfer Facility, while Asian LNG commentary often uses assessments for delivered cargoes, including the Japan Korea Marker. These names do not identify interchangeable products. Delivery location, contract month, physical specification and assessment method matter. A comparison should first place prices on compatible energy and currency units, then identify which transport and handling costs are included. A delivered cargo assessment cannot be treated as the same economic object as a domestic hub quotation. Even within one country, regional hubs can diverge when pipeline access is constrained. A benchmark is a reference point for a particular market, not the price paid by every household, factory or importer.
Pipeline capacity can dominate local economics
A producing region can have abundant gas and a low local price while a consuming region faces scarcity. The missing element may be transport capacity rather than geological supply. Pipelines connect particular places; they do not provide unlimited access to every destination. Maintenance, compressor availability and competing nominations can change how much gas moves over a short horizon. An imagined producer selling at four monetary units cannot assume access to a distant market quoting seven if the connecting route is fully booked. The apparent three-unit spread must also cover applicable transport charges and other delivery obligations. Conversely, constructing more takeaway capacity can change local price relationships over time. Understanding a regional differential therefore requires a map of infrastructure and access rights, not merely a comparison of production and consumption totals.
LNG connects markets through a costly chain
Liquefaction makes ocean transport possible by cooling natural gas into a much smaller liquid volume. It also requires specialized plants and energy. The cargo then needs a suitable vessel, available loading and unloading facilities, and regasification access before entering a pipeline network. The destination price must be considered alongside this entire chain. In a purely hypothetical calculation, a hub input cost of three plus liquefaction, shipping and terminal costs totaling four produces a delivered cost of seven before additional contractual adjustments. A destination quotation of eight does not automatically create one unit of freely available profit: capacity commitments, losses, timing and commercial risk remain. LNG links regional markets, but those links are conditional. The existence of export and import terminals does not mean their spare capacity or contractual rights match at every moment.
Contract design shapes who can respond
A supply agreement allocates more than volume. It determines delivery obligations, pricing formulas, duration and the ability to redirect a cargo. Some arrangements reference oil prices; others use gas benchmarks or combinations of terms. Consequently, an importer’s average purchase cost may adjust differently from the latest spot assessment. Long-term commitments can provide visibility for buyers and project financing for suppliers, while flexible arrangements can help respond to changing regional demand. Neither label alone establishes whether a contract is economical or secure. The price formula, delivery responsibilities and available alternatives must be read together. A spot price surge may affect the marginal replacement cargo much more than an already contracted shipment. This distinction helps explain why two companies importing similar volumes can report different costs and different exposure to a disruption.
Stored volume is not the same as deliverability
Storage moves supply across time, but inventory alone does not describe operational resilience. Working gas is the portion available for withdrawal under normal operating conditions, whereas some gas remains necessary to maintain a facility’s pressure and operation. Facilities also differ in how quickly they can inject or withdraw gas. A large inventory with a limited withdrawal rate may not meet an abrupt demand peak. Location matters as well: stored gas must still reach the consumers who need it. An analyst should therefore separate volume, percentage fullness, withdrawal capability and transport access. Comparing inventories with a historical seasonal range can provide context, but weather, demand patterns and infrastructure may have changed. Storage reduces vulnerability to some shocks; it does not eliminate the possibility of local shortages, congestion or exceptionally expensive marginal supply.
Weather affects both demand and the power mix
Gas demand is seasonal, but winter heating is only one channel. Hot weather can raise electricity consumption for cooling and increase gas-fired generation where that generation provides incremental power. Wind, solar, hydro and nuclear availability can also change the amount of gas required by the electricity system. The same temperature anomaly can therefore have different effects across regions with different buildings, industries and power fleets. Industrial activity adds another layer: fertilizer, chemicals and other users respond to production needs and fuel economics. A useful reading distinguishes a weather-driven peak from a sustained change in industrial consumption. It also asks whether the relevant weather forecast is already reflected in prices. Surprise, duration and location matter more than a general statement that the season is cold or hot.
A regional shock can travel without equalizing prices
Suppose an unplanned outage reduces supply in one importing region. Buyers may seek additional LNG cargoes, raising the value of flexible supply and drawing shipments from alternative destinations. That response can transmit pressure internationally even if the original outage is local. Yet prices need not converge completely. Shipping distances, available terminals, pipeline bottlenecks and contract restrictions preserve regional differences. The transmission can also run through demand: a buyer unable to pay for replacement gas may reduce consumption, freeing supply elsewhere at a real economic cost. This is not evidence that the system has adjusted painlessly. Distinguish the price mechanism that reallocates a scarce resource from the welfare consequences for households and industry. Connectivity can share a shock across regions while also providing options that an isolated market would lack.
Wholesale gas and consumer bills move differently
A wholesale quotation is not a household tariff. Final bills can include network services, taxes, retail costs and the effects of procurement arrangements or regulation. Industrial users also differ in contract structure and their ability to substitute fuels or change production schedules. As a result, a lower hub price may reach some consumers quickly and others only after a reset period. Gas can influence broader prices through electricity, process heat and selected industrial inputs, but the strength of these channels depends on each economy’s structure. It is misleading to translate a percentage move in wholesale gas directly into the same percentage move in consumer inflation. The size of the energy share, contract timing and the decisions of firms and governments all sit between the benchmark and the final price basket.
Build a regional balance before interpreting a headline
A practical reading framework begins by naming the region, delivery period and benchmark. Next, identify production and imports, the main demand sectors, storage conditions and the capacity that connects these elements. Then ask which constraint is binding: unavailable gas, transport, terminal access, contractual flexibility or the speed of demand adjustment. Separate a temporary maintenance event from a persistent infrastructure limitation. Compare prices only after aligning units and delivery terms, and distinguish spot exposure from contracted average costs. Finally, state what evidence would change the interpretation. A warmer forecast, restored pipeline, additional cargo or weaker industrial demand can alter the balance through different routes. This approach replaces broad claims about a single global gas market with a testable explanation of why particular buyers face particular prices at a particular time.
Sources & further reading
Primary institutional sources underpin this educational guide. Follow the links for the original definitions, methods and research. Hypothetical examples in the text are explanatory, not current quotes or forecasts.
- EIA: Factors affecting natural gas prices ↗
- EIA: Liquefied natural gas ↗
- EIA: Natural gas prices ↗
- EIA: Basics of underground natural gas storage ↗
- EIA: Delivery and storage ↗
- EIA: Market dynamics at key pricing hubs ↗
- IEA: Natural Gas Security Policy ↗
- IEA: Gas 2025 executive summary ↗
- IEA: Gas reserve mechanisms and flexibility options ↗
- EIA: The natural gas futures market ↗
- ICE: Dutch TTF natural gas futures specifications ↗
- S&P Global: Platts JKM LNG price assessment ↗
Explore the data and markets
Continue your research
All guides →
Copper and Industrial Demand: Reading Construction, Grids, Supply and Inventories
How copper links industrial activity, electrification, mining and recycling—and why its price is an imperfect economic barometer.

Agriculture and Food Price Shocks: From Harvests and Fertilizer to Household Costs
Trace how weather, stocks, energy, trade and currencies shape agricultural markets—and why supermarket prices respond differently.

Commodity Futures Curves: Contango, Backwardation and the Economics of Time
Understand how storage, scarcity, seasonality and contract rolls shape commodity curves—and why a futures curve is not a price forecast.