
Critical minerals recycling: collection, recovery and the economics of circular supply
Why installed metal is not immediately available scrap, and how collection, quality, recovery and commercial terms determine secondary supply.
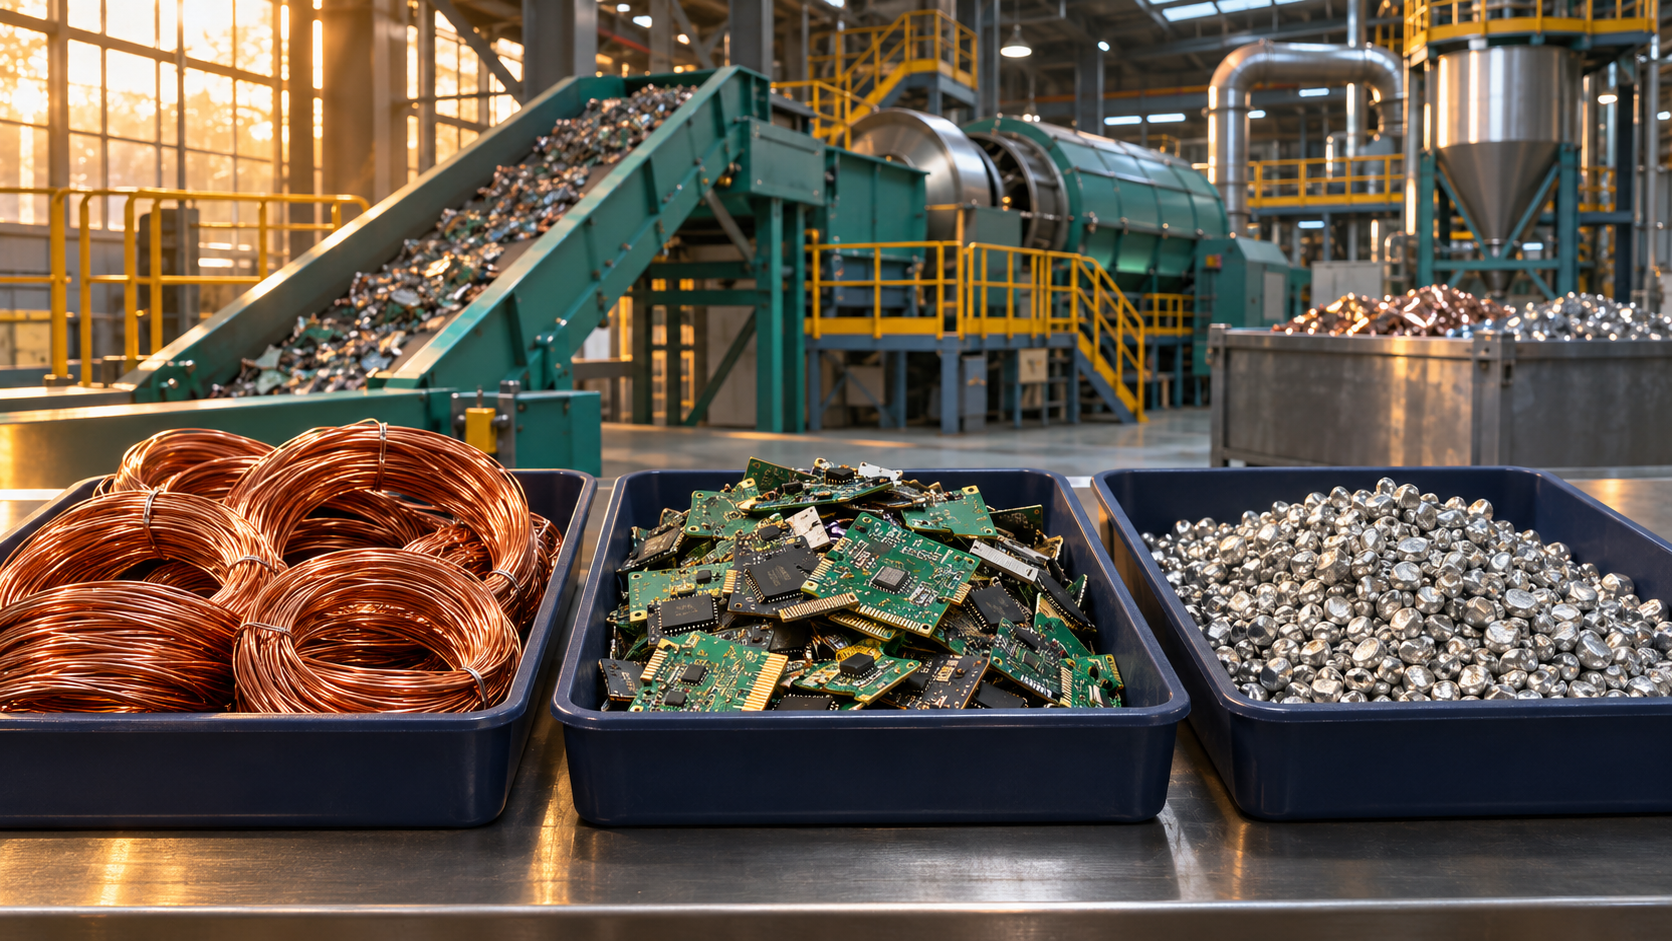
Recycling is a supply chain, not a single machine
Secondary mineral supply begins long before a recovery plant receives material. Products must become available, be collected, transported and sorted, then processed into outputs that a customer can actually use. Every stage has costs, losses and timing constraints. A technically recoverable metal is not automatically commercially available supply. The useful distinction is between metal contained in discarded objects and qualified material delivered to a buyer. Copper cable, electronic equipment, alloy scrap and rare-earth magnets also require different collection and processing systems. This guide focuses on those economic relationships rather than extraction chemistry or a forecast for any specific metal. Recycling can diversify supply and reduce pressure on primary production, but the size and timing of its contribution depend on the entire chain. A recovery percentage by itself cannot describe that contribution.
Installed metal is a stock, available scrap is a flow
Metal already installed in buildings, vehicles and equipment is often described as an urban resource. That description does not mean it can be recovered immediately without destroying useful assets. Product lifetimes, replacement decisions and demolition schedules determine when material becomes scrap. Manufacturing scrap is different: it arises during production and can return relatively quickly, often with better-known composition. End-of-life scrap arrives after use and may be dispersed or mixed. A rapidly expanding economy can accumulate metal in long-lived assets faster than old material returns. Even excellent recycling therefore may not cover new demand. Forecasts should separate manufacturing scrap from end-of-life flows and model the age of installed products. Counting the entire installed stock as next year's available feedstock is a category error, not an optimistic recycling assumption.
Collection economics determine what reaches the plant
A large industrial cable batch and thousands of small household devices may contain valuable metals but present very different collection costs. Distance, handling, ownership, information and the value of each collection trip affect participation. Products can remain in drawers, enter mixed waste or move through channels that are poorly measured. Convenient return systems and reliable aggregation can therefore matter as much as a higher processing recovery rate. Collection statistics also need a defined boundary: equipment collected domestically is not necessarily equipment processed domestically. Some flows are reused, exported or stored before treatment. For analysis, follow documented material through each stage and avoid assuming that every discarded unit is captured. The commercial bottleneck may be assembling a consistent feedstock stream, even when technically capable processing capacity already exists and metal demand is strong.
Recovered material must meet a useful specification
Metal value depends on more than its presence. Mixed alloys, coatings, attached components and contamination can make separation costly or reduce the range of applications for the recovered output. Sorting improves knowledge of composition and can preserve value before processing. Some secondary material substitutes closely for primary metal after appropriate refining; other material is suitable only for different or less demanding applications. It is therefore misleading to equate tonnes recovered with tonnes of fully interchangeable supply. Quality qualification, consistency and customer acceptance belong in the supply forecast. A buyer may value traceable, reliable material more than a cheaper irregular stream. Conversely, over-specifying purity for an application that does not need it can waste resources. The economic objective is useful material at a justified cost, not the highest theoretical recovery or purity number in isolation.
Sequential losses change the headline recovery rate
Consider an explicitly hypothetical end-of-life stream containing 100 units of a target metal. If collection captures 60 percent, only 60 units reach processing. If that processing recovers 80 percent of the contained metal it receives, final recovery is 48 units: 100 multiplied by 0.60 and then by 0.80. The overall result is 48 percent, not 80 percent. Raising collection to 75 percent while holding processing recovery at 80 percent produces 60 units, a 25 percent increase relative to 48. This arithmetic demonstrates why an upstream improvement can matter even without a new recovery technology. It assumes the collected material is comparable and the plant can handle the additional flow. Real systems must also account for sorting losses, rejected material and whether the recovered output meets a saleable specification.
Different recycling ratios answer different questions
Collection rate, end-of-life recycling rate and recycled content have different denominators. Collection concerns material captured from an eligible waste stream. End-of-life recycling concerns what ultimately returns from discarded material. Recycled content concerns the share of secondary inputs in a new product or supply stream. A fast-growing market can have effective end-of-life recovery but modest recycled content because past consumption was much smaller than present demand. Conversely, a high recycled-content product does not prove that the wider system collects most discarded products. Manufacturing scrap and post-consumer scrap should also be identified separately. Historical institutional studies are valuable for these definitions, but their numerical estimates should not be presented as current conditions. Before comparing claims, write the numerator, denominator, geography, year and material boundary. Without that discipline, apparently conflicting percentages can all be correct.
Contained value is not the recycler’s margin
A scrap parcel's theoretical metal value is not the revenue a recycler necessarily receives. Payable recovery, quality discounts, processing charges and contractual allocation of by-products affect realization. The recycler may purchase feedstock, receive a service fee, or combine both arrangements depending on the stream. In a hypothetical batch, realized revenue of 80 currency units less 30 for feedstock, 25 for processing and 10 for logistics leaves 15 before capital costs, financing, taxes and other overhead. It is not a net profit estimate for the industry. A rise in metal prices may lift revenue but also raise the price paid for scrap, narrowing the benefit. Working capital matters because cash can be tied up between acquisition and final settlement. Analyze the whole commercial contract rather than multiplying contained metal by an exchange quotation.
Processing capacity needs feedstock at the right time
Announced recycling capacity describes an ambition or a facility limit, not guaranteed annual output. A plant needs permits, financing, reliable operation, qualified customers and sufficient suitable feedstock. Capacity built ahead of scrap availability can remain underused even when long-term material demand looks attractive. Conversely, a sudden wave of retired equipment can overwhelm local collection or sorting before recovery plants receive usable material. Model commissioning, ramp-up and feedstock development separately. Do not assume that every capacity announcement is additional: projects may replace older facilities or process material already counted elsewhere. Product design changes also affect future scrap composition, so a plant optimized for yesterday's stream may need adaptation. A credible forecast links specific discard cohorts to collection systems, processing capability and saleable outputs, rather than adding project announcements into a single optimistic supply number.
Policy and trade shape the collection network
Product design, traceability, collection incentives and producer-responsibility arrangements can change who pays for recovery and how material reaches processors. Cross-border trade can connect dispersed scrap with efficient specialized facilities, while also creating a need for clear classification, documentation and environmental safeguards. Restricting a flow may support one local objective but reduce another facility's feedstock; opening a flow without oversight can move environmental costs elsewhere. These are economic trade-offs, not a statement of any jurisdiction's current legal rules. Evaluate policies against the bottleneck they address and check their actual implementation date before drawing conclusions. Environmental comparisons also need a lifecycle boundary, including collection, transport, processing energy and the primary material displaced. More recovered tonnes can be beneficial without every route having the same environmental or commercial performance.
Build a stock-and-flow view of circular supply
A useful recycling scenario starts with demand by application, the installed stock and its age distribution. Estimate when products leave service, then apply collection, sorting, recovery and qualification assumptions in sequence. Distinguish the technical ceiling from the economically achievable case and show where uncertainty is largest. Add costs and contractual terms before interpreting a higher recovered volume as stronger profitability. Compare recycling with repair, reuse, material efficiency and substitution, because these can reduce new mineral demand while changing future scrap availability. Finally, retain primary supply in the model where growing demand and long product lives make it necessary. The central question is not whether recycling works in principle. It is how much qualified secondary material reaches users, at what cost, in which year, and which primary requirement it actually displaces. Those details turn a circular-economy slogan into a measurable supply analysis.
Test a scenario. Explore the market.
Hypothetical inputs for learning. Change the assumptions to see the arithmetic; these are not current market values or forecasts.
Same period for both inputs. Before taxes and fees. Formula: (1 + return) ÷ (1 + inflation) − 1. Methodology ↗
Input limits: returns, inflation and currency changes −99% to 1,000%; duration 0–30; yield changes −200 to 200 basis points.
Open an interactive market chart
Market context, not a direct measure of every subject in this article. Provider data may be delayed or unavailable. Check the instrument, quote currency and timestamp.
Open the full market workspace →Sources & further reading
Primary institutional sources underpin this educational guide. Follow the links for the original definitions, methods and research. Hypothetical examples in the text are explanatory, not current quotes or forecasts.
- IEA: Recycling of critical minerals, executive summary ↗
- USGS: What do we know about metal recycling rates? ↗
- IEA: Reliable supply of minerals ↗
- OECD: Material resources ↗
- OECD: Resource efficiency and trade in metals and minerals ↗
- US EPA: Sustainable management of electronics and batteries ↗
- European Commission JRC: E-waste ↗
- ITU: Global E-waste Monitor 2024 ↗
Explore the data and markets
Continue your research
All guides →
Oil refining: crack spreads, product markets and the cost of turning crude into fuel
How crude quality, product yields, operating costs and inventories shape refining economics, with a worked 3-2-1 example.

Uranium Markets: Fuel-Cycle Services, Contracts and Security of Supply
Separate uranium material from civilian fuel-cycle services, then examine procurement schedules, inventory coverage and the economics of supply delays.

Lithium Economics: Chemical Grades, Battery Demand and Supply-Chain Bottlenecks
Follow lithium from deposits to qualified battery chemicals, examining benchmarks, project timing, inventory cycles, substitution and recycling.