
Shipping, Supply Chains and Inflation: From Freight Rates to Consumer Prices
Trace how transport capacity, route disruption, delivery delays and inventory decisions can affect costs and inflation.
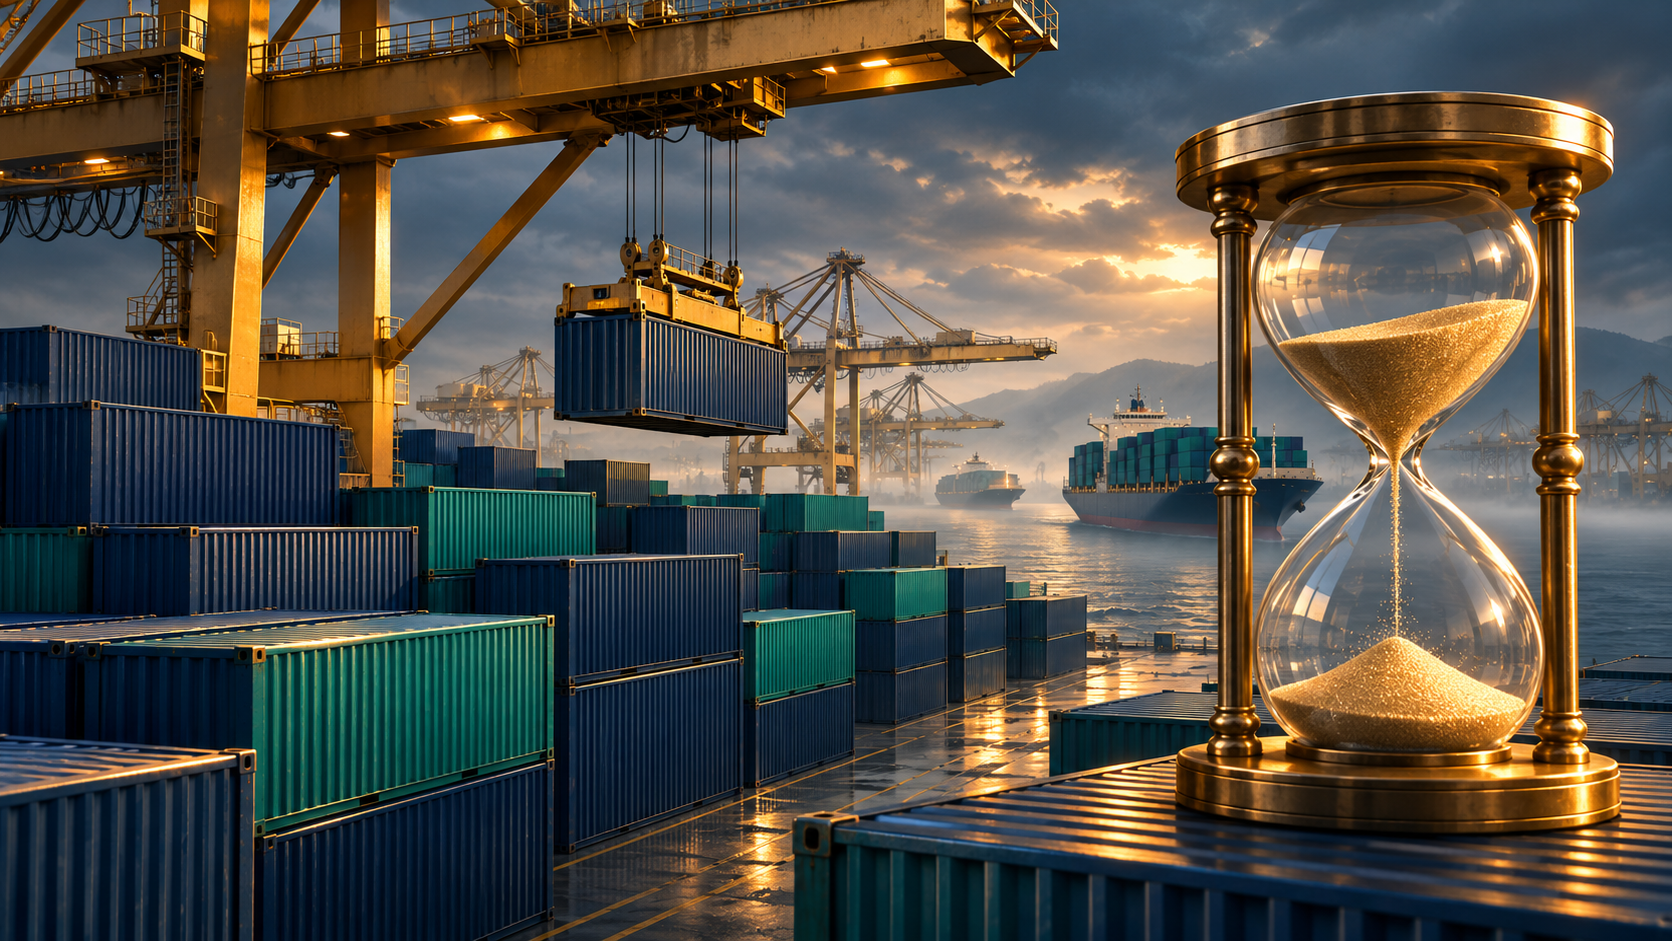
Freight is a price for movement and time
A freight rate is more than a charge for carrying a box across the sea. It prices access to a transport network at a particular time, on a particular route, under particular contractual conditions. When that network becomes congested, firms face both a higher invoice and a less predictable delivery schedule. These problems can influence production, inventory and retail pricing through different channels. A useful analysis separates the direct transport cost from the indirect cost of delayed goods or missing components. It also distinguishes the price of shipping from the quantity of goods being shipped. A higher freight index can accompany strong demand, reduced effective capacity or both. Understanding which mechanism dominates is essential before interpreting a shipping headline as evidence about inflation or economic growth.
Choose the right shipping measure
Container shipping, dry bulk and tanker transport serve different cargoes and can follow different cycles. Containers commonly carry manufactured and intermediate goods; dry bulk vessels carry unpackaged commodities such as grain and ore; tankers move liquid cargoes. Their rates are not interchangeable indicators of the same shortage. Even among container measures, a spot booking price differs from the cost of chartering an entire vessel or a longer-term contract rate. A route-specific increase may disappear inside a broad average, while a dramatic average may exaggerate the exposure of a particular importer. Before using an index, establish its cargo type, routes, units, frequency and contractual basis. The indicator should match the economic question. A factory importing components needs different transport evidence from an exporter moving grain or a refinery receiving crude oil.
Longer routes reduce effective capacity
The number of ships is not the same as the amount of transport service available each month. A vessel spending longer at sea or waiting outside a port completes fewer journeys over a given period. Rerouting can therefore absorb capacity without removing a single ship from the fleet. Imagine, purely for illustration, a service whose round trip lengthens from thirty to forty days. Maintaining the same departure frequency would require additional vessel time, while fuel, crew and scheduling costs might also change. The exact commercial outcome depends on the service design, not this simple ratio alone. Congestion can spread because late arrivals disrupt the next port call, container return and inland connection. A local obstruction can consequently become a network problem even when the cargo’s origin and final destination are unaffected directly.
Ports are one link in a longer chain
A fast berth operation cannot compensate for every weakness elsewhere in the logistics chain. Goods must pass through terminals, documentation, customs and onward transport before reaching the buyer. A shortage of warehouse space, trucks or rail capacity may leave containers occupying space needed for incoming cargo. Conversely, a vessel-time indicator can reveal maritime delays while missing difficulties faced after unloading. The World Bank’s Container Port Performance Index focuses on vessel time in port, making it useful for a defined operational question rather than a complete score of every logistics service. Read performance measures alongside their scope and the external shocks affecting them. The practical question is where an additional hour accumulates and which organization has the ability to remove it, rather than simply assigning a broad label of efficient or inefficient.
The direct cost depends on the value inside the container
The same freight increase has different significance for different products. Suppose, hypothetically, that the transport bill for a shipment rises from two thousand to four thousand monetary units. If its merchandise value is one hundred thousand, the extra cost is two percent of that value before other charges. For goods worth twenty thousand, the same increase is ten percent. This arithmetic does not predict the retail price response, but it explains why cargo value, density and packaging matter. Businesses may absorb part of the increase, renegotiate terms or change sourcing. Payment currency and exchange-rate movements can reinforce or offset the shock. To trace the direct channel, identify the actual landed-cost structure rather than applying a percentage increase in a freight index to the entire value of imported goods.
A missing low-value input can stop high-value output
The indirect channel can be more important than the transport invoice. A small component arriving late may prevent a factory from completing a much more valuable product. The economic loss then includes idle capacity, overtime to recover the schedule and postponed sales, not merely freight. Firms can respond by holding more inventory, qualifying alternative suppliers or using faster transport for critical items. Each response has a cost and may be unsuitable for some goods. An additional warehouse protects against one type of delay but ties up working capital and can create obsolete stock. The useful distinction is between cheap transport and reliable delivery. A route with a slightly higher quoted rate may have a lower expected total cost if its timing is more predictable, though that judgment depends on the buyer’s production process.
Pass-through is delayed and incomplete
A higher import cost does not instantly become a higher consumer price. Existing inventories may have been purchased at earlier costs, supplier contracts may delay renegotiation, and retailers may choose to protect sales by accepting lower margins. Later, replacement inventory and contract renewals can bring the shock into observed prices. The response also depends on competition, domestic demand and how much imported content the final product contains. Empirical studies by the IMF, OECD and central banks find that shipping shocks can influence prices, but estimates differ with the measure, sample and identification method. Those results should be read as conditional evidence, not a universal multiplier. An analyst should state which price index is being discussed: border prices, producer prices and consumer prices describe different stages of the chain.
Separate demand strength from a supply disruption
A jump in freight rates can arise because customers want more goods or because the network can move fewer goods. These are different economic stories even when the observed price movement is similar. Strong orders, rising volumes and capacity utilization may support a demand explanation. Falling throughput, longer transit times and disrupted routes may support a supply explanation. Mixed cases are common, so a single indicator rarely settles the issue. The New York Fed’s Global Supply Chain Pressure Index combines transport and manufacturing information to summarize pressures, but it is not a direct measure of every firm’s bottleneck. Use composite indicators to organize evidence, then examine their components and regional coverage. A headline signal becomes more useful when its underlying mechanism and limits are made explicit.
Falling freight rates do not undo every effect
When transport prices fall, relief can arrive unevenly. Firms may still hold expensive inventory, face other rising costs or operate under contracts that reset slowly. A decline in one input cost therefore need not reverse the previous retail increase in full. Moreover, a lower inflation rate means prices are rising more slowly; it does not necessarily mean the price level is falling. The interpretation also depends on why freight became cheaper. Improved capacity and smoother ports can support supply, while collapsing orders can signal weaker demand. Both can reduce a shipping index, but their implications for production and employment differ. Avoid declaring that a logistics crisis is over on the basis of one price series. Delivery reliability, capacity utilization and business inventories provide additional evidence about the state of normalization.
Trace the route from disruption to the final price
A rigorous assessment follows a sequence. Identify the disruption, the affected routes and cargoes, and the change in effective capacity. Establish whether the quoted rate is spot, contract or charter, and compare it with the buyer’s actual exposure. Then separate the direct freight bill from delay-related production costs and inventory responses. Follow the timing into import, producer and consumer prices, allowing for exchange rates and other inputs. Finally, describe alternative explanations and the evidence that would distinguish them. A route reopening, faster port turnaround or restored supplier output does not act through exactly the same channel. This framework turns a dramatic transport headline into a set of specific, testable relationships. It also prevents shipping from becoming a convenient explanation for every price increase regardless of the product, market or period.
Sources & further reading
Primary institutional sources underpin this educational guide. Follow the links for the original definitions, methods and research. Hypothetical examples in the text are explanatory, not current quotes or forecasts.
- ECB: What is driving the surge in shipping costs? ↗
- New York Fed: Global Supply Chain Pressure Index ↗
- IMF: Shipping Costs and Inflation ↗
- OECD: Container shipping costs and import and consumer prices ↗
- World Bank: Container Port Performance Index ↗
- UNCTAD: Review of Maritime Transport 2025 ↗
- UNCTAD: Maritime chokepoints and supply chain vulnerability ↗
- Boston Fed: Shipping cost surges and US import price inflation ↗
- IMF: From Ports to Prices ↗
- OECD: International transport and insurance costs ↗
- World Bank: Shipping and Ports ↗
- UNCTAD: Review of Maritime Transport 2022 ↗
Explore the data and markets
Continue your research
All guides →
Productivity, Wages and Living Standards: How Economic Gains Reach Households
A practical guide to output per hour, capital deepening, multifactor productivity, pay distribution and the limits of economic averages.

Demographics and Ageing Economies: Work, Pensions, Care and Capital
How population age structures interact with employment, migration, pension systems and investment—and why demographic projections are not economic destiny.

Diversification and Correlation Regimes: Why Relationships Matter More Than Labels
Understand covariance, changing correlations, hidden factor concentrations and the limits of diversification during stress.